TheMarceloR
::Troubleshooting, Coding and Comic Books
Old Generation And Gc Logs
23 Jan 2011 - Marcelo Costa
Minor Collection e Full GCs
When the Garbage Collection occurs in the Young Generation, we have a minor collection, when it occurs on the Old Generation we have a Full GC (Stop the world, M&S), here is a representation of a minor collection taken from the GC logs:
17767.137: [GC [PSYoungGen: 1052672K->175413K(1228096K)] 3100706K->2233257K(4035264K), 0.4126550 secs] [Times: user=0.78 sys=0.02, real=0.42 secs]
You see? It is just as simple as this:
Let’s try to understand what each value means:
- 17767.137 = Elapsed time in seconds since the JVM was started.
- [PSYoungGen: 1052672K->175413K(1228096K)] = Space taken up on the Young Generation BEFORE the GC -> Space that was taken up on the Young Generation AFTER the GC
- 3100706K->2233257K(4035264K) = Space taken up on the entire heap BEFORE the GC – > Space taken up on the entire heap AFTER the GC (You should not consider the Permanent Generation)
- 0.4126550 secs = Time of GC operation [Times: user=0.78 sys=0.02, real=0.42 secs] = refer to the table below:
| Time stat | description |
|---|---|
| Real | is wall clock time – time from start to finish of the call. This is all elapsed time including time slices used by other processes and time the process spends blocked (for example if it is waiting for I/O to complete). |
| User | is the amount of CPU time spent in user-mode code (outside the kernel) within the process. This is only actual CPU time used in executing the process. Other processes and time the process spends blocked do not count towards this figure. |
| Sys | is the amount of CPU time spent in the kernel within the process. This means executing CPU time spent in system calls within the kernel, as opposed to library code, which is still running in user-space. Like ‘user’, this is only CPU time used by the process. |
*When in doubt, just read User+Sys.
Isn’t that amazing? Now you can see a log entry like this one and interpret what is going on (to generate these log entries use the following argument: -verbose:gc, or, if you want to see this on a specific file, -Xloggc:file), you can start creating graphics showing what is happening with your JVM in a given moment, like this one:
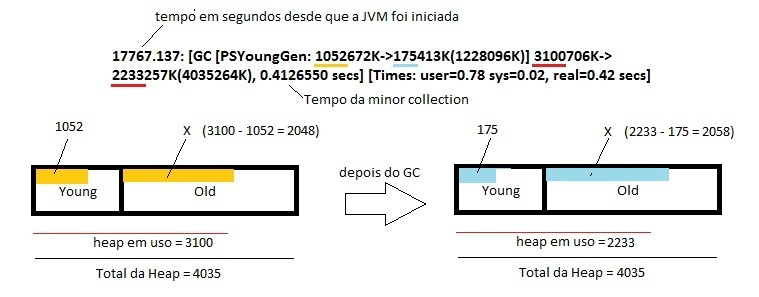
This way we can confirm that 10 mb of objects were promoted to the Old generation, do you agree?
Here is an example of how the Full GC is represented in the logs:
17684.691: [Full GC [PSYoungGen: 175417K->0K(1228096K)] [ParOldGen: 2715481K->2019446K(2807168K)] 2890899K->2019446K(4035264K) [PSPermGen: 118571K->118548K(163840K)], 6.1196070 secs] [Times: user=11.34 sys=0.02, real=6.12 secs]
You can use tools to visualize this kind of activities, for example, the GC Viewer:
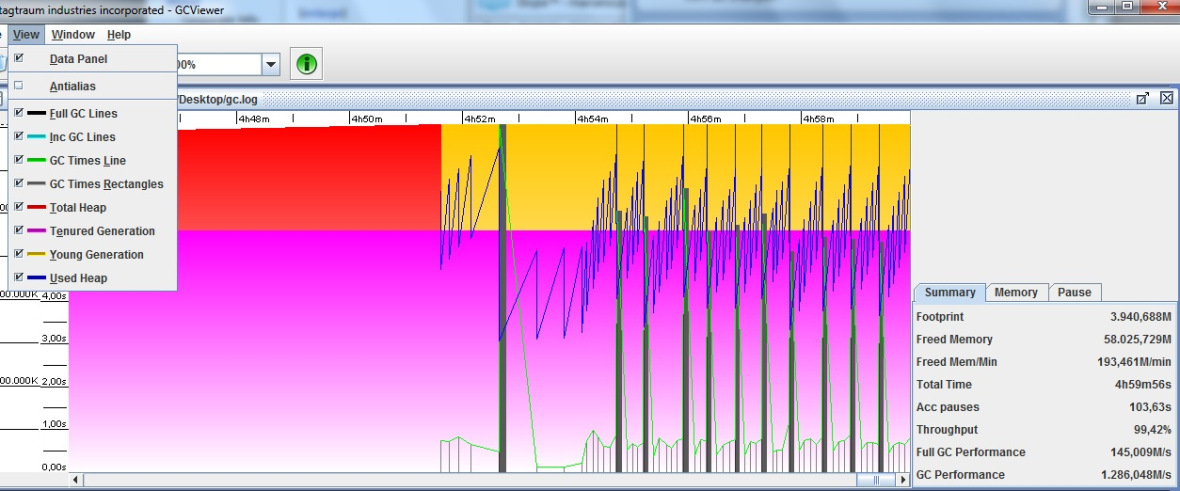
Again, why this is so interesting? Because, with this knowledge, you can solve performance problems and even tune your JVM, the most common issues (that involve memory) are caused by:
- Number and size of objects.
- Average lifetime of an object
- Size of the Heap.
That’s it for now. See you on the next post.