TheMarceloR
::Troubleshooting, Coding and Comic Books
Out Of Memory Errors And Heap Dumps
25 Jan 2011 - Marcelo Costa
OMG! an Out Of Memory error!

Exception in thread “ThisIsM-YThread-0” java.lang.OutOfMemoryError: Java heap space. This error just showed up in your application logs? Run to the hills!
In times like this it’s common to hear someone saying:
“Well, we can just add more memory to the server…”.
Ideally we need to investigate what really happened. Adding more RAM to a server or reconfigure the -Xmx (JVM argument that defines the maximum space of the Heap) it’s not the silver bullet here. See, per instance this bowl full of water:

Imagine that at the bottom of this bowl, there’s a hole to drain the water. It keeps filling until a certain level e gets drained in an ideal pace. Everything ok so far? Ok, now imagine the same scenario where the water stream is so strong that it’s filling the space faster than the hole can drain, which means, eventually it will overflow. Therefore, considering this scenario, we have to ask ourselves: Does increasing the size of the bowl solve our problem?
The water is going to overflow regardless, the ‘OutOfMemoryError’ is going to happen anyway because you might have humongous objects in your heap or many many long living objects that are being constantly created faster than the Garbage Collection process can sweep them away (http://en.wikipedia.org/wiki/Memory_leak).
So, you can generate a Heap Dump to analyze these objects. Here are a few methods to generate Heap Dumps:
- -XX:+HeapDumpOnOutOfMemoryError
- -XX:+HeapDumpOnCtrlBreak (Windows)
- jmap -dump:format=b,file=HeapDump.hprof
(JVM’s PID)
- The HeapDump will be generated in the ‘working directory’ (e.g., In Tomcat, the HeapDump is generated in the /bin folder) Here’s a good resource that gathers all the best approaches to generate Heap Dumps:
http://wiki.sdn.sap.com/wiki/pages/viewpage.action?pageId=33456
How do I read a Heap Dump?
You are going to need a tool that can interpret the Heap Dump, I recommend IBM Heap Analyzer and the Eclipse Memory Analyzer. If you already generated your Heap Dump file in the .hprof format so it is ready to be analyzed.
IBM Heap Analyzer: http://www.alphaworks.ibm.com/tech/heapanalyzer
1) Run the ‘ha398.jar’ file with the following command:
java -jar ha398.jar
If the Heap Dump is a large file, you might need to allocate more memory to the tool:
java -Xmx1800m -jar ha398.jar
If you have a decent machine, eventually you will gonna get through this screen here:
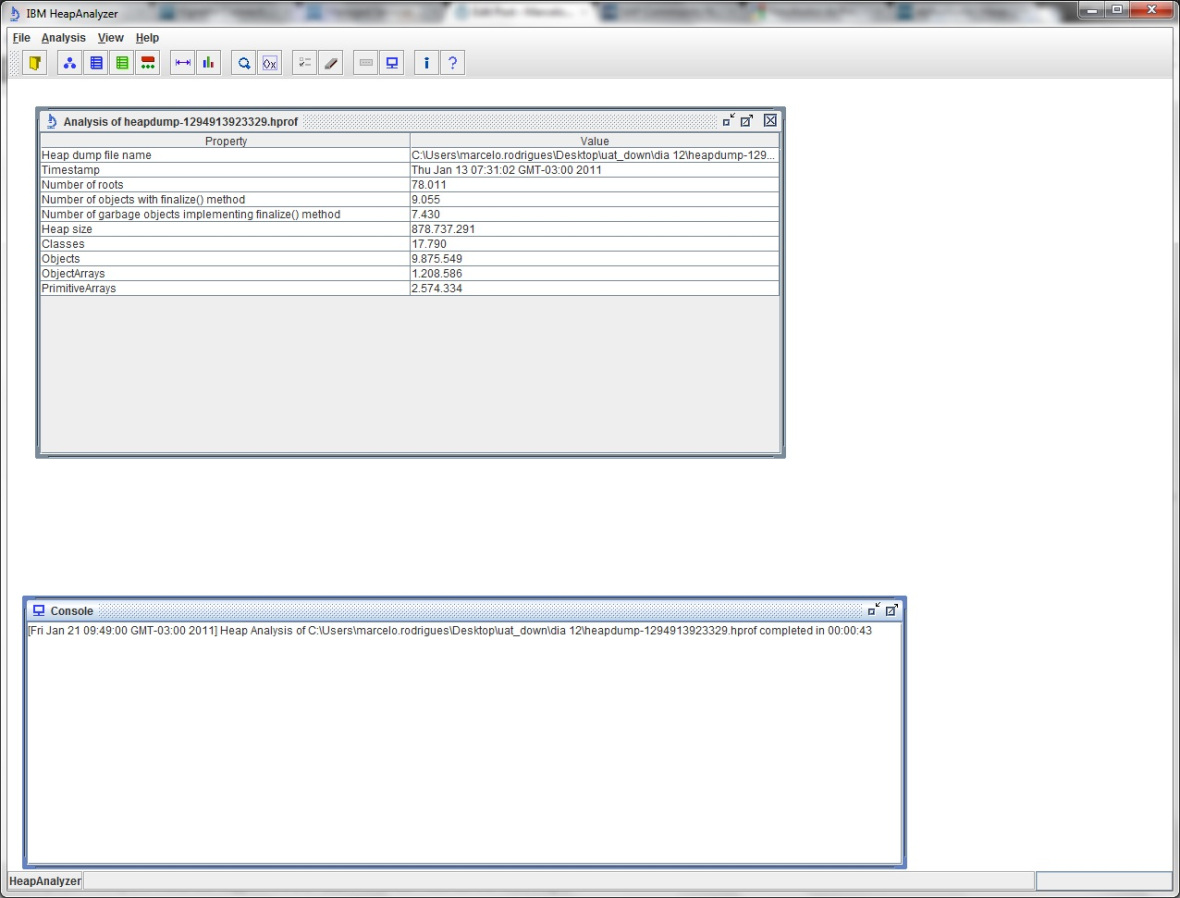
2) After that, we will see a summary with Heap details:
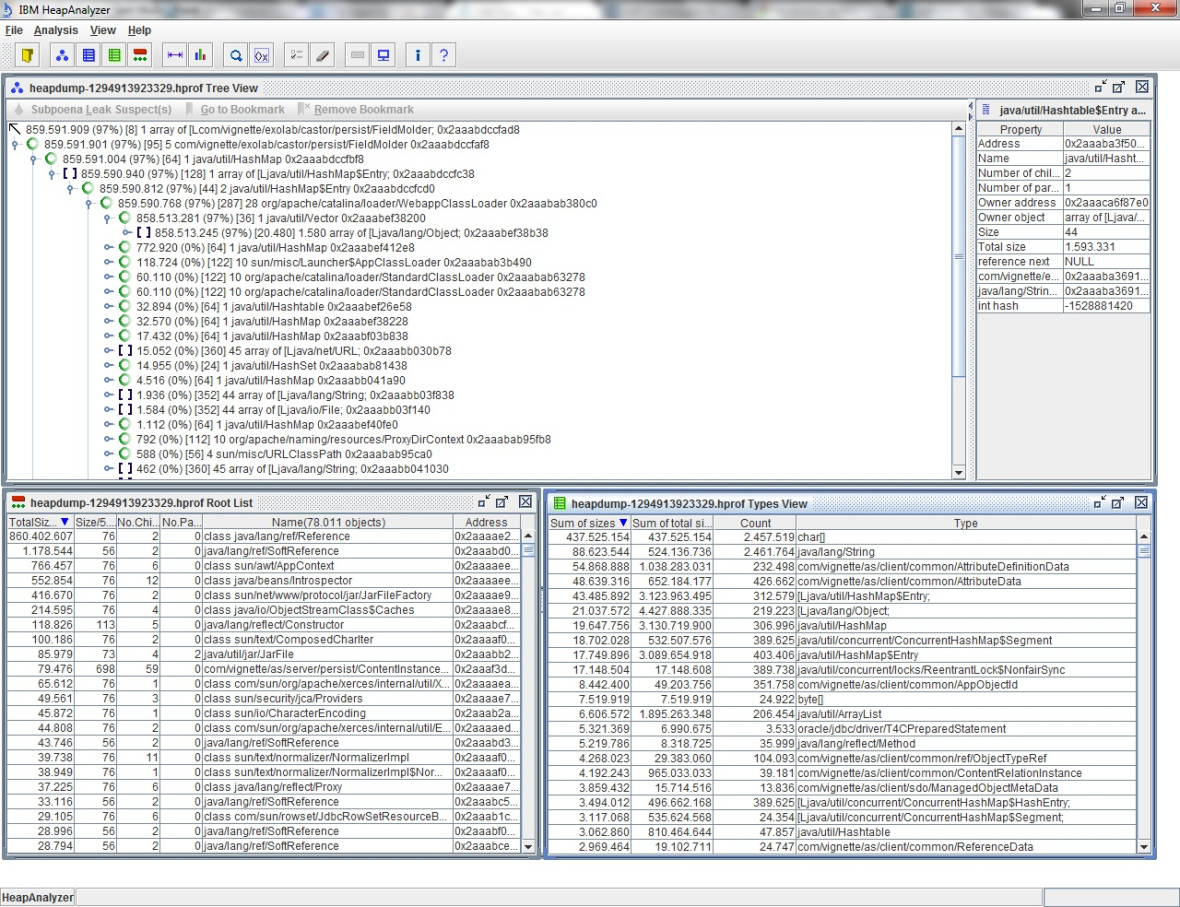
3) The analysis will take different paths depending on the scenario. If you are looking for specific objects, like a few instances that are taking up too much space or large number of objects that are gradually occupying most of the Heap (i.e., Leak Suspect), the tool provides different ways of visualizing the objects (Object Types, instances and associations):
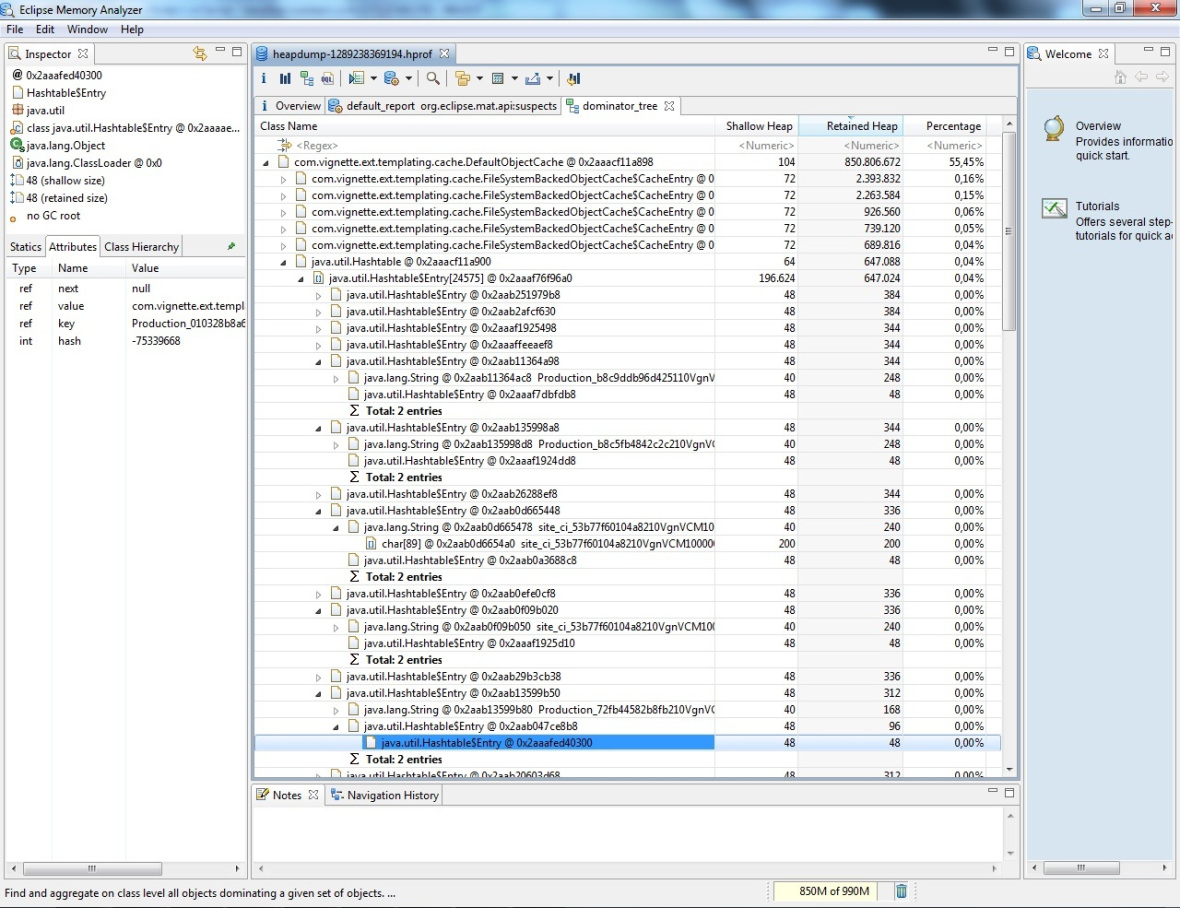
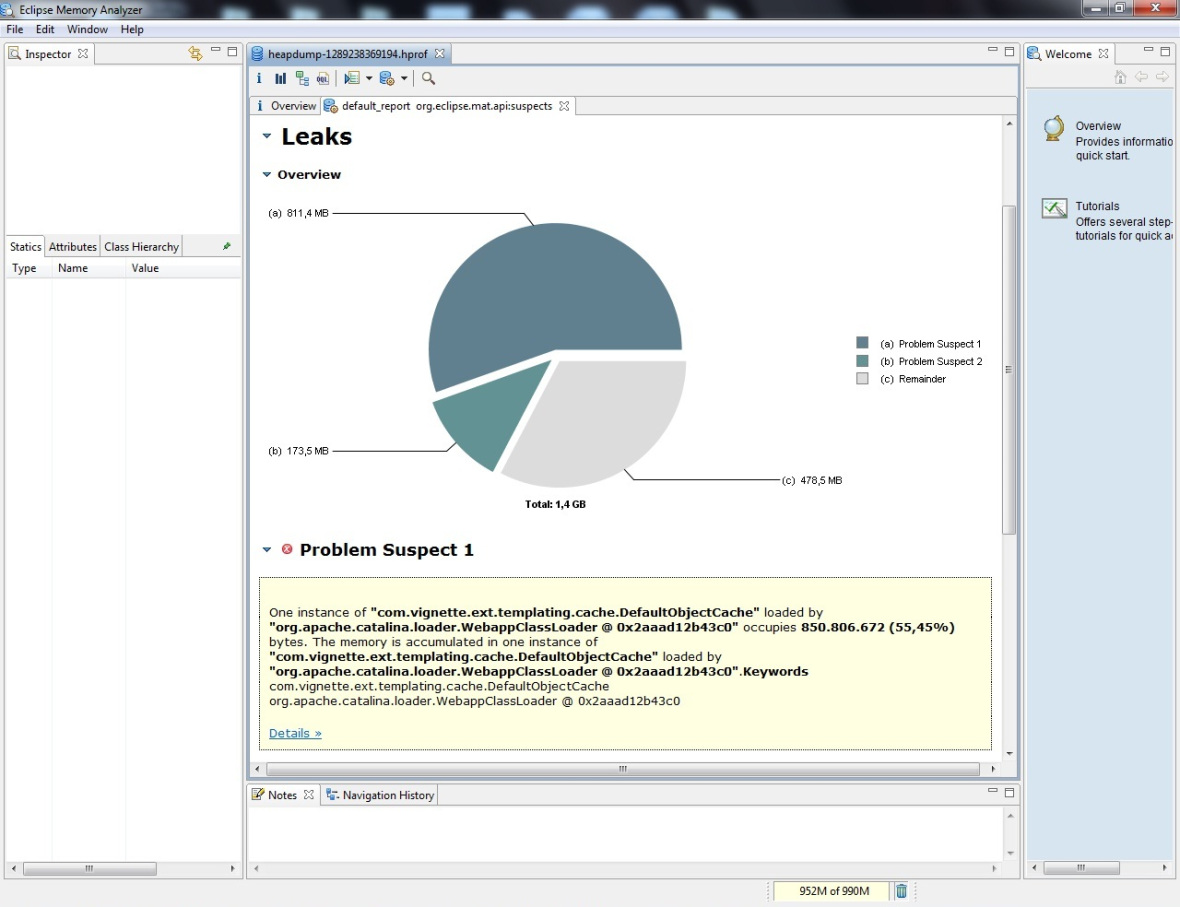
The ‘Eclipse Memory Analyzer’ works in a similar way, but beyond the cool graphs, it can focus the analysis by automatically identifying the leak suspects providing a report that starts from the Threads that were allocating these objects when the Heap Dump was taken:
Remember that the leak suspect routines might lead to wrong conclusions, don’t trust in any automatic analysis, understand how your application works e verify what is being expected and what is not, don’t assume that you can open any Heap Dump and point out the culprit, understanding the low-level functionalities is surely helpful.
Another advantage of Eclipse Memory Analyzer it’s the interface, check out this ‘tree view’: