TheMarceloR
::Troubleshooting, Coding and Comic Books
Sre In 10 Minutes
10 Dec 2021 - Marcelo Costa
Let us talk about SRE
I noticed that some engineers from Dev teams were curious about the actual role of an SRE and what exactly is our skillset, so I decided to invest some keystrokes to explain some of the stuff we work with and share one common practice used by SREs to monitor the performance of a service.
What is SRE?
SRE (Site Reliability Engineering), at its core, is about one thing:
- “Keeping the lights on.”
While that simple phrase covers a lot, SRE encompasses a broad set of practices aimed at ensuring system reliability and availability. This means not only maintaining uptime, but also continuously improving processes in collaboration with the broader engineering organization. Key areas of focus include enhancing observability, streamlining incident management and prevention, and making systems more discoverable and maintainable.
What Site Reliability Engineers actually do?
We focus on ensuring reliable, scalable, and efficient systems. Here are a few bullet points with some of the responsibilities of SRE:
- Work with SLOs, SLAs and SLIs.
- A big part of our work involves key reliability concepts, often expressed through three important acronyms:
- SLO (Service Level Objective): Internal performance targets that reflect a desired level of reliability offered to users. For example, an SLO might define that a service should be available 99.9% of the time.
- SLA (Service Level Agreement): Externally agreed-upon reliability commitments, often formalized in contracts and if these targets are not met, that results in financial penalties.
- SLI (Service Level Indicator): Quantitative measures of service performance. These are derived from metrics such as latency, availability, error rate, throughput, response time, durability, etc.
- A big part of our work involves key reliability concepts, often expressed through three important acronyms:
- Pursue maximum change velocity without violating a Service’s SLO (shamelessly copied from The SRE Book as this is a critical one).
- Engineer automation to eliminate toil – Automate ourselves out of the job to work on innovation. That includes the development of tools to facilitate operational requirements like creating a service catalog, scaffolding on-call rotations or maintaining runbooks (aka: playbooks).
- Observability – Track system health by managing alerts, dashboards and mastering monitoring tools — SREs are often the first responders when something goes wrong.
- Manage Incidents – If the end-users are not having a great experience, if there is any service disruption, we jump in and do whatever it takes to restore the system to a healthy state. This bullet point also includes managing Post Mortems, which is basically analyzing why/how the incident happened, sharing knowledge about its mitigation/resolution and ask ourselves: How do we prevent it from happening again?
- Come with automation / tooling to improve system resiliency while dealing with changes – We definitely DO NOT want to impact development velocity, so we might just throw an idea here and there or even provide automation/new tooling to increase transparency, to rollback changes and mitigate/resolve regressions.
- Basically, the SRE’s role is to continuously improve things – Always looking for opportunities to improve telemetry resources, left-shifting incident detection, streamline CI/CD, review best practices, adopt new technologies, etc.
And, to make sure we are doing a good job, we also measure our success through another set of acronyms like MTTD, MTBF and MTTR:
- MTTD (Mean Time To Detect): The average time it takes to detect that something has gone wrong in a system. This measures how quickly issues are identified after they occur and is critical for reducing downtime.
- MTBF (Mean Time Between Failures): The average amount of time a system or component operates without failure. A higher MTBF indicates better reliability and stability over time.
- MTTR (Mean Time To Recover or Repair): The average time it takes to restore service after a failure has been detected. This includes diagnosing the issue, fixing it, and returning the system to normal operation.
To learn more about each of these SRE responsibilities, let us talk one cool SLI that is easy to understand and monitor.
The Success Rate
The Success Rate, or just SR, is a simple indicator that can help everyone with measuring the success of a system in flight.
SR monitoring is a good method to observe customer satisfaction. It can inform if a whole system, as its success and failures bubble up throughout its inter-service communication, is working as expected or not.
The SR drop of a service_name can be used as an elegant approach to define the severity of incidents. For example, let’s assume there is an entry in a service catalog that contains the following guideline: SR < 99.9% for 5 minutes = *Sev 1*, then On-Call engineers will know how to initiate the incident management flow through an easy and intuitive process.
Such guidelines can also offer some granularity, e.g., let’s say shopping-cart-service could face different ranges of SR drops within different time-frames, resulting in incidents with different severities, such as:
- SR < 99,90 % for > 1 min = sev3
- SR < 99,00 % for > 3 mins = sev2
- SR < 90,00 % for > 5 mins = sev1
Note that we can adjust the severity while incrementing the 9’s and decrementing the time-frame OR decrementing the number of 9’s and incrementing the time-frame (i.e., we have end-users impacted in both scenarios). However, the severity will vary between services as it should be defined according to the TIER of the service, i.e., it is a common practice to record services in a catalog that contains metadata, which includes a tier definition.
High latency scenarios can also be monitored along with the success rate and work with the same time-frame criteria to determine whether the system is severely degraded, e.g., service A was producing minutely-aggregated response times above 900ms for more than 5 minutes, which is more than half of the number of minutes of allowed downtime in a week considering a 99.9% SLO (as per https://uptime.is/99.9), hence, a Sev2 incident should be declared (this “allowed downtime” is also known as Error Budget). If services are configured to raise timeout errors, high latency issues can also be captured by the success rate monitoring.
The SR is also a great tool to empower more automation. If we have an easy way to probe into the SR values for each service through a CLI / py-sdk / go-sdk or even a HTTP API, then the possibilities are endless. We could do cool things like:
- Automatically trigger mitigation mechanisms (rollback any recently-deployed version, swing traffic to a different cluster, restart shards, disable feature toggles, check downstream services and automatically check for saturation(e.g., cpu, memory pressure) and scale up services, etc.).
- Enable circuit-breaking / throttling for some requests.
- Automatically notify subject matter experts / service owners.
The SR is a very basic, yet very powerful SLI.
Ok, but what exactly is this SR thing?
To illustrate, let us consider web-based / HTTP RESTful API micro-services. We can measure the success of such API services based on the HTTP response codes they produce:
SR (Success Rate) =
100 * (1 - (num of 5xx's / total num of requests))
This is the predominant archetype among the pieces of software we usually work with, although the same method can be adopted for other types of services like RPC (Remote Procedure Call) APIs, event workers, etc., as long as there are metrics to distinguish errors and the total amount of transactions, you can calculate the SR.
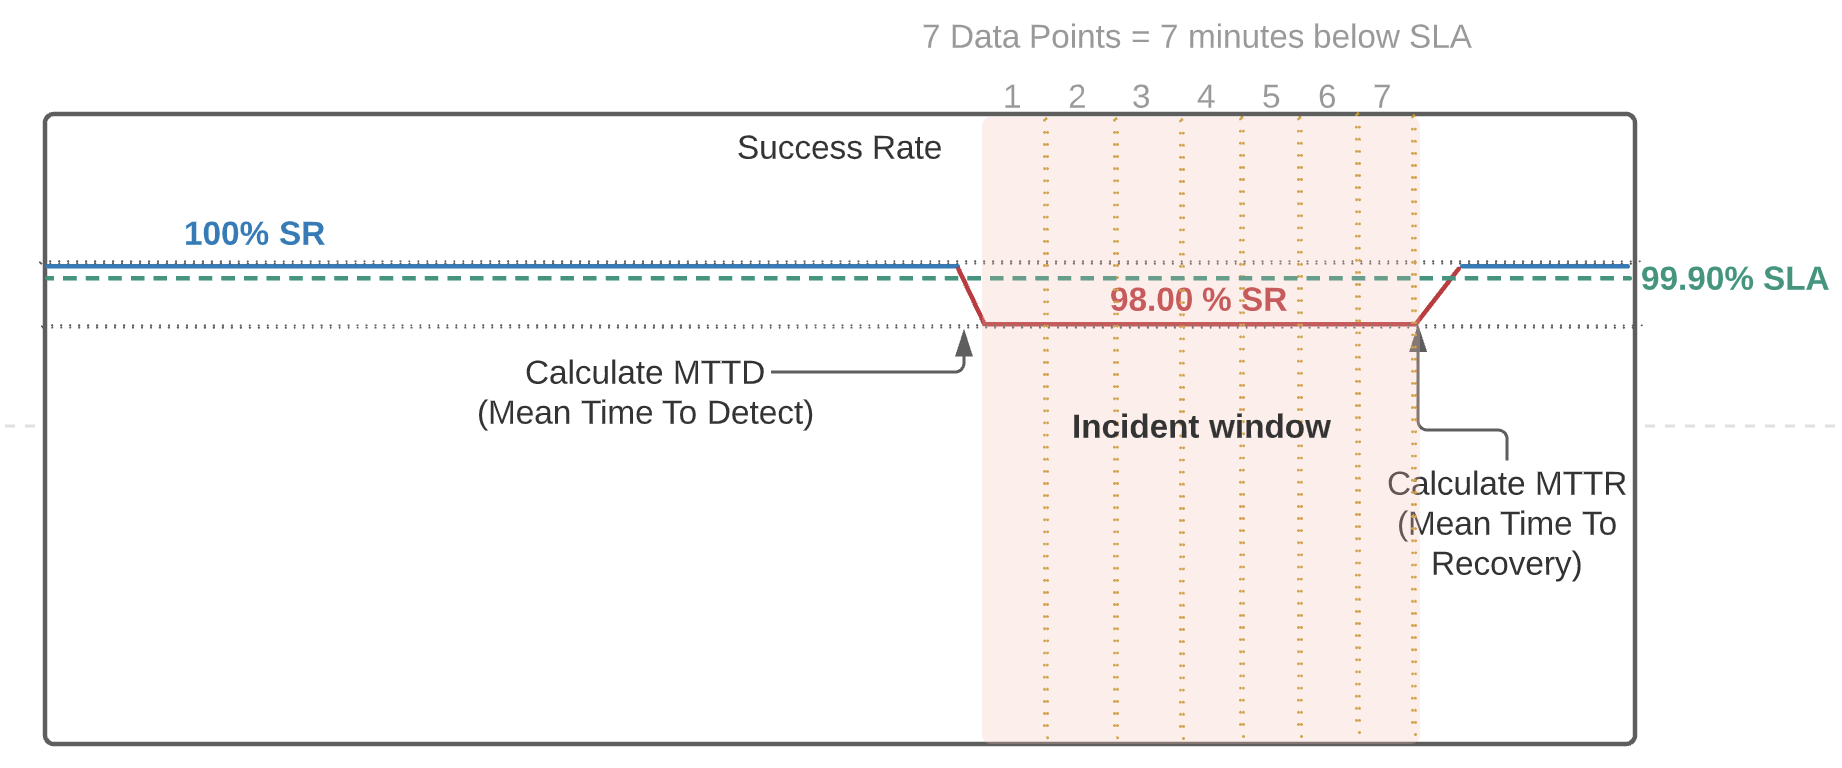
Now it is easy to look at an incident and figure out how much of our “error budget” is being used. Here’s a diagram illustrating some SR drop & the time-frame in which a service was operating below the SLA of 99.90 %:
To reflect around the impact of that let’s check the following excerpt from the SRE Workbook:
The SLI ranges from 0% to 100%, where 0% means nothing works, and 100% means nothing is broken. We have found this scale intuitive, and this style lends itself easily to the concept of an error budget: the SLO is a target percentage and the error budget is 100% minus the SLO. For example, if you have a 99.9% success ratio SLO, then a service that receives 3 million requests over a four-week period had a budget of 3,000 (0.1%) errors over that period. If a single outage is responsible for 1,500 errors, that error costs 50% of the error budget.
Having tools that easily present the SRs from all mission-critical services are quite handy to track the time-frame in which a service is operating below the SLA. The On-Call engineer / IMOC (Incident Manager On-Call) can keep an eye on everything and get ready to react in case one or more services turn RED for too long.
Here is an example of how to graph the Success Rate for a service using PromQL (Prometheus Query Language), you can try that in a panel of a Grafana dashboard if you have a Prometheus or Mimir datasource and a service emitting the http_server_duration_count metric (which you should get for free by using the OpenTelemetry automatic instrumentation).
100 * (
 1 - (
  (
   sum(rate(http_server_duration_count{service_name="my-service",deployment_environment="prod",http_status_code=~"5.+"}[5m]))) or vector(0) /
   sum(rate(http_server_duration_count{service_name="my-service",deployment_environment="prod",http_status_code=~".+"}[5m]))
 )
)
I should write a whole other blog post about OTel :D
How do we restore the Success Rate and mitigate incidents?
SREs can be proactive with the tools we have at our disposal, AWS services configuration, feature flag toggling or rolling back services to previously-stable versions (according to service-specific Runbooks, of course), scaling up resources, or (my personal favorite) using a multi-region traffic swinging mechanism.
Whenever the incident involves a complex problem that requires idea-bouncing with the actual experts (service owners), we do need to escalate issues with the 2nd Layer of incident response (our Subject Matter Experts, aka: SMEs).
A common practice is to centralize the communication around the incident (usually an ephemeral Slack channel is automatically created through SRE tools), then the Incident Commander (IC) drives the incident management and we all tackle the problem together to pursue a mitigation.
Putting it all together
In this article, we explored SRE capabilities by discussing the success rate SLI as a practical example of a method to observe the performance of one or more services, covering some of the nuance around priorities based on tier definition and incident severity definition (aligned with business impact). We also briefly touched on how an engineering org can leverage a service catalog for discoverability, eliminating communication overhead, streamlining processes and empowering tooling orchestrations. We talked about on-call rotations, escalation, incident mitigation and post mortems and we also covered an example of a HTTP API service and how its SR can be observed with Prometheus metrics.
The goal here was to share some concepts and provide just enough information to get your feet wet with SRE and spark some ideas for you to start building some tooling and processes around your service’s success rate monitoring.
What else?
Well. That’s it for now… There are many things to unpack for each of these topics and there are several other ones we could discuss but this first blog post should unveil lots of interesting details for SRE neophytes.
I hope you enjoyed this post!